Half of XPeng's Gross Profit Now Comes From Somewhere Other Than Cars
A 64-follower Weibo account claimed XPeng earns 20,400 yuan per car against 22,100 of R&D. Its numbers reconcile with XPeng's filings - and show something bigger: in Q2 2026 the non-vehicle business, mostly technical R&D services and parts, made 2.03bn yuan of gross profit at a 75% margin, matching the car business's 2.06bn. What the per-car maths gets right, where its conclusion goes wrong, and what Monday's Q3 print resets.
A finance-adjacent Weibo account with 64 followers posted a minute-long video on 14 November arguing that XPeng's car business earns less per vehicle than it spends on research, and that the company's real money comes from outside the car. It has no likes, no comments and 50 views. On the usual rules of engagement, that is not a source.
Except the video's own opening frame cites XPeng's 2025 annual results and its 2026 second-quarter results, and prints the raw numbers. So instead of dismissing it, we checked them against the filings. They reconcile to within rounding — and the most interesting sentence in the video is not the one about losing money per car.
What the video claims
Three numbers, in its own words: of every ¥100 XPeng takes in, ¥89 comes from selling cars and ¥11 from parts and technical R&D services; selling one car earns ¥20,400; and the R&D allocated per car is ¥22,100 — "it earns less than it spends."
The frame it opens on also publishes its workings (values in thousands of yuan, recomputed by the account's own script):
- 2025: vehicle revenue ¥68.38bn, vehicle gross profit ¥8.781bn; non-vehicle revenue ¥8.34bn, non-vehicle gross profit ¥5.692bn.
- 2026 Q2: vehicle gross profit ¥2.059bn; non-vehicle gross profit ¥2.025bn.
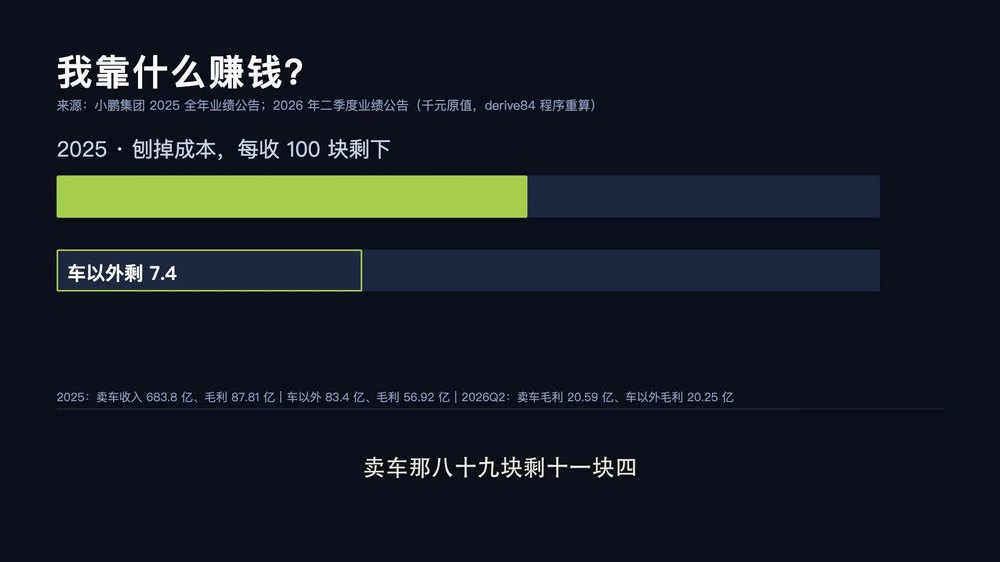
The frame the video opens on: sources cited, figures printed in thousands of yuan, and the ¥89/¥11 split it derives from them. Image: 危机投资实验室 (Weibo).
The numbers check out
Against XPeng's own releases, the 2025 figures hold:
- Total revenue 2025: ¥76.72bn. 68.38 + 8.34 = 76.72, so the 89.1 / 10.9 split is right, and the video's "89 and 11" is a rounding of it.
- Gross profit 2025: 8.781 + 5.692 = ¥14.47bn, which is 18.9% of revenue — exactly the full-year gross margin XPeng reported.
- Vehicle margin 2025: 8.781 / 68.38 = 12.8%. The non-vehicle side ran at 68.2%.
- ¥8.781bn over 429,445 deliveries = ¥20,447 of gross profit per vehicle. The video says ¥20,400. It is right.
- ¥22,100 of R&D per car implies roughly ¥9.5bn of R&D for the year. He Xiaopeng has put 2025 R&D at "about ¥10 billion", which works out at ¥23,286 per car. Same ballpark, same story.
So the per-car claim is not a sloppy viral number. It is a correctly derived one, from the correct documents.
The sentence that matters
"车外生意的吸金能力远超卖车" — the money-making power of the non-vehicle business far exceeds selling cars.
Look at the Q2 2026 row the video itself prints: vehicle gross profit ¥2.059bn, non-vehicle gross profit ¥2.025bn. Those are not "far exceed" — they are equal, to within 2%.
And the reason is the margin gap. In the June quarter XPeng reported:
- Vehicle margin 12.1%, on ¥17.05bn of vehicle revenue — down from 14.3% in Q2 2025 and flat on the March quarter.
- Services and others margin 75.1%, on ¥2.70bn — up from 53.6% a year earlier.
Run it per delivered vehicle (103,295 in the quarter):
| Per vehicle delivered, Q2 2026 | RMB |
|---|---|
| Vehicle revenue | 165,061 |
| Vehicle gross profit | 19,972 |
| Services gross profit | 19,630 |
| Group gross profit | 39,499 |
| R&D expense | 28,172 |
| Net loss | −12,973 |
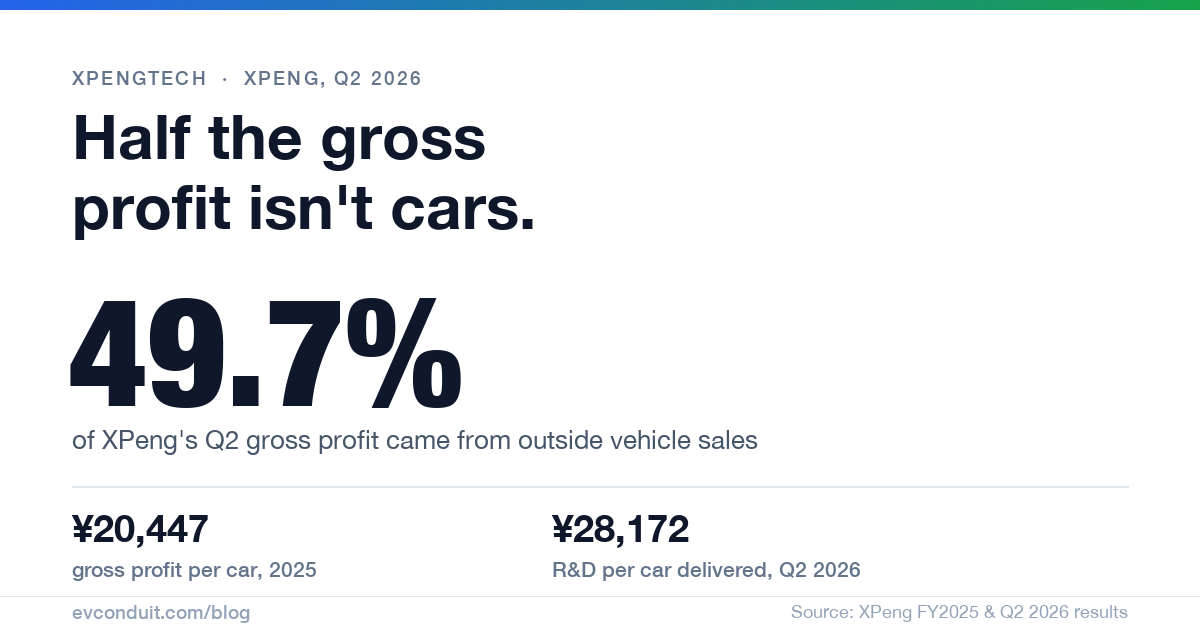
Thirteen per cent of revenue is generating half the gross profit. 49.7% of XPeng's gross profit last quarter came from something that is not a car — and per vehicle sold, the services business contributed within ¥350 of what the car itself contributed.
That is a much stranger fact about XPeng than "it loses money per car", and the video is right to point at it.
What the services business actually is
The Q2 filing is specific: the increase came from technical R&D services rendered to a car manufacturer — described only as "the Manufacturer", anonymised in the document — where "certain key milestones" were achieved in the quarter, plus parts and accessories.
XPeng's publicly announced collaboration of that type is with Volkswagen, which licensed its platform and electrical architecture; the filings do not name the counterparty, and milestone-based fees make this revenue lumpy by design. It rose 93.9% year on year in Q2. In the March quarter the same line ran at a 66.5% margin; in June, 75.1%.
So the second engine is real, it is high-margin, and it is not a car.
Where the video's conclusion goes wrong
"挣的还没花得多" — earns less than it spends — is true at the level of one car and one R&D line, and misleading at the level of the company.
- Per vehicle, gross profit (¥19,972) is below R&D (¥28,172). Correct.
- Per quarter, gross profit (¥4.08bn) is above R&D (¥2.91bn) by about ¥1.17bn. The net loss of ¥1.34bn comes after sales, general and administrative costs — not because the metal is sold below its cost.
- The R&D line is not a car cost. It funds chips, robotaxis, humanoid robots and the flying-car programme. XPeng's robotics business raised over US$900m in the quarter at a US$6.3bn valuation, and IRON is slated for 2027 deliveries. He Xiaopeng said in April that excluding R&D into those new areas, the car business was profitable for the full year in 2025 — and could be again in 2026. That is management's framing, not an audited split, but it is the same accounting question the video answers the other way.
So the per-car arithmetic is a legitimate way to say "the car business is not yet funding the company's ambition". It is not evidence that each car is sold at a loss.
Three things that will change these numbers immediately
- Q3 results land on Monday 16 November. Guidance was 115,000–121,000 deliveries and ¥21.7–23.4bn of revenue — a range that straddles the record quarter XPeng set in Q4 2025. Every per-car figure above will move, and the gap between vehicle and services margin is the number to watch.
- Services revenue is milestone-driven. A quarter without a Volkswagen milestone falls back toward parts and accessories, and the "half of gross profit" finding weakens with it. One quarter is not a trend.
- Vehicle margin is the pressure point. It fell from 14.3% to 12.1% year on year even as revenue per car rose — the company is selling more expensive cars at a lower margin, which is what industry-wide cost pressure looks like from the inside.
The bottom line
The video's numbers survive contact with the filings: ¥20,447 of gross profit per car in 2025 against roughly ¥22,000–23,000 of R&D per car, and an 89/11 revenue split that is exactly XPeng's 2025 mix. What does not survive is the framing that this shows the cars are unprofitable. The car business covers its direct costs and then some; what it does not cover is a research budget that is now funding robots, chips and aircraft — plus a services business that, last quarter, made as much gross profit as the cars did.
That is the real finding: XPeng has quietly become a company whose gross profit is half non-car, half car. Whether that is a technology company subsidising cars or a carmaker subsidising technology is the question the next few quarters will answer — starting with Monday's print.
Source: 危机投资实验室 (Weibo), checked against XPeng Group's FY2025 and Q2 2026 results.
Enjoyed this? Get the next one direct.
New articles, or a daily / weekly digest — delivered to your inbox.